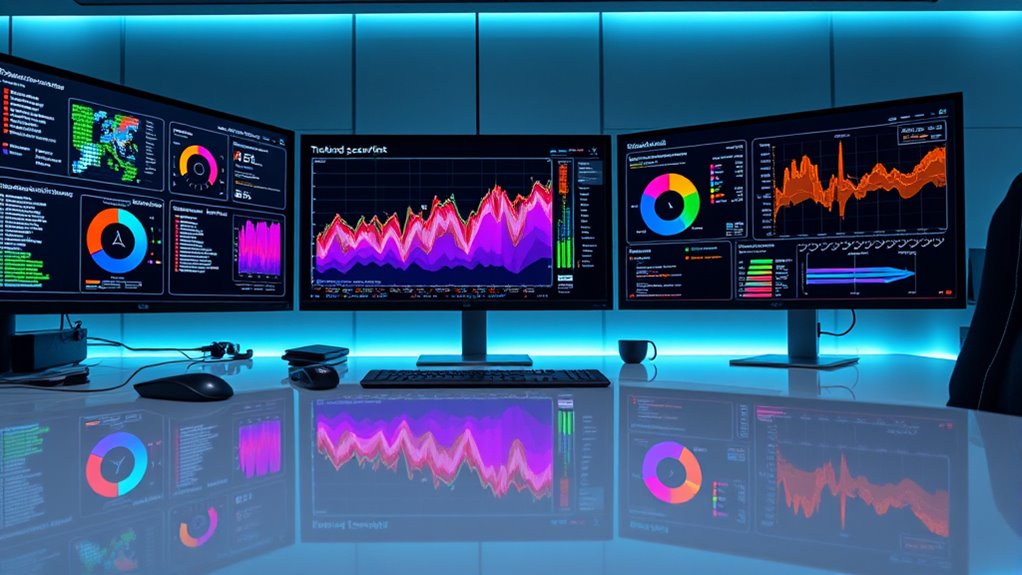
Using open-source dashboards like Grafana and Kibana lets you visualize security events in real time, making it easier to spot anomalies, track trends, and respond quickly to threats. These tools connect with your data sources, allowing you to create custom visualizations that highlight unusual activity or sudden spikes. Visualizing your threat data helps you detect subtle issues early and understand evolving attack patterns. Keep exploring to learn how to maximize these dashboards for your security needs.
Key Takeaways
- Open-source dashboards like Grafana and Kibana enable real-time visualization of security logs and events for quick anomaly detection.
- They support integration with diverse data sources, allowing comprehensive graphing of security metrics and alerts.
- Visualizing trends over time helps identify persistent threats and evolving attack patterns proactively.
- Customizable dashboards improve collaboration among security teams and facilitate clear communication of incidents.
- Open-source tools allow automation and extension with plugins, enhancing threat detection and response capabilities.

Visualizing security events through graphing is essential for quickly identifying patterns and anomalies in your network. When you turn raw data into visual formats, it becomes much easier to spot threat detection opportunities and understand the overall health of your security environment. Graphing tools help you see relationships between events, detect unusual activity, and pinpoint potential breaches before they escalate. By leveraging open-source dashboards, you gain flexible, adaptable solutions that fit your specific needs without hefty costs. These dashboards allow you to connect various data sources, such as logs, network flows, and system alerts, creating detailed visualizations that provide instant insights into your cybersecurity posture.
Anomaly visualization is central to effective threat detection. When you monitor security events visually, you can quickly recognize deviations from normal patterns. For example, a sudden spike in login attempts or unusual data transfers may stand out immediately on a graph, prompting further investigation. Open-source tools like Grafana or Kibana enable you to develop dashboards tailored to your network’s unique traffic, making it easier to identify subtle anomalies that might otherwise go unnoticed in text-based logs. These tools support real-time updates, so as new data flows in, your visualizations stay current, allowing you to respond swiftly to emerging threats.
Implementing graphing solutions for security event analysis also enhances your ability to perform trend analysis over time. By visualizing data across different periods, you can identify recurring attack vectors, persistent vulnerabilities, or evolving attack strategies. This proactive approach helps you refine your security policies and strengthen defenses against future threats. Additionally, open-source dashboards often come with plugins and integrations that extend their capabilities, enabling you to incorporate machine learning models or anomaly detection algorithms directly into your visualizations. This integration automates part of the threat detection process, reducing manual effort and increasing accuracy.
Furthermore, adopting open-source graphing tools fosters collaboration within your security team. Visual dashboards make complex data accessible to everyone, from analysts to executives, facilitating better communication about security incidents and responses. When everyone can see the same visual context, decisions become faster and more coordinated. These tools also support sharing and exporting visualizations, allowing you to document incidents or create reports for compliance purposes easily.
Frequently Asked Questions
How Do Open-Source Dashboards Compare to Commercial Security Tools?
Open-source dashboards often excel in data integration, allowing you to customize and connect various data sources easily. They typically offer a user interface that’s flexible and user-friendly, but may require more technical skill to set up and maintain. Commercial security tools usually provide polished interfaces and dedicated support, but can be costly. Your choice depends on your needs for customization, budget, and technical expertise.
What Are the Best Open-Source Options for Real-Time Event Visualization?
Think of Grafana as your modern-day Oracle, providing real-time event visualization with seamless data integration and easy user access. It’s highly customizable, allowing you to create dynamic dashboards that update instantly. Kibana, paired with Elasticsearch, offers powerful visualization for security logs, while Graylog provides centralized log management. These tools give you quick insights, helping you monitor security events proactively and guarantee your team can access critical data effortlessly.
How Can Dashboards Be Customized for Specific Security Policies?
You can customize dashboards for specific security policies by adjusting the layout, widgets, and data sources to match your security priorities. Use dashboard customization features to incorporate policy integration, ensuring relevant alerts and metrics are highlighted. Tailor visualizations and filters to reflect your organization’s policies, enabling quicker insights and more effective monitoring. This approach helps you stay aligned with your security needs while providing clear, actionable data.
What Are Common Challenges in Implementing Open-Source Security Dashboards?
Did you know that 65% of organizations face data integration issues when implementing open-source security dashboards? You might struggle with inconsistent data sources or complex configurations. Additionally, user training becomes a challenge as staff need to learn new tools and interpret visualized data effectively. To overcome these hurdles, focus on streamlined data integration processes and all-encompassing training programs, ensuring your team can leverage the dashboard’s full potential.
How Do Open-Source Dashboards Handle Data Privacy and Compliance?
Open-source dashboards handle data privacy and compliance by incorporating privacy considerations into their design, such as data anonymization and access controls. You should implement compliance strategies like regular audits and adherence to industry standards to protect sensitive information. By customizing these dashboards, you guarantee that privacy considerations are prioritized, and compliance requirements are met, allowing you to effectively monitor security events without risking data breaches or regulatory penalties.
Conclusion
By mastering open-source dashboards, you can turn your security data into a crystal-clear masterpiece, revealing threats faster than you ever thought possible. With these powerful tools, you’re not just monitoring events—you’re staying several steps ahead of cyber villains lurking in the shadows. Embrace these techniques, and you’ll transform your security operations into a well-oiled machine, making complex data look as simple as a breeze. Get ready to conquer security analytics like a true digital superhero!


